

Yesterday Lending Club filed a S-3ASR with the SEC which provides comprehensive and updated information on the business. For those who are interested in the inner workings of Lending Club’s business the document is a great resource to get your questions answered. While much of the information seemed to remain the same or similar, a portion of the filing was dedicated to loan originations and performance. Below we’ve taken out some charts which may be interesting to Lend Academy readers which includes data through the first quarter of 2017.
Our previous analysis on recent performance trends is located here and only included data through Q3 2016.
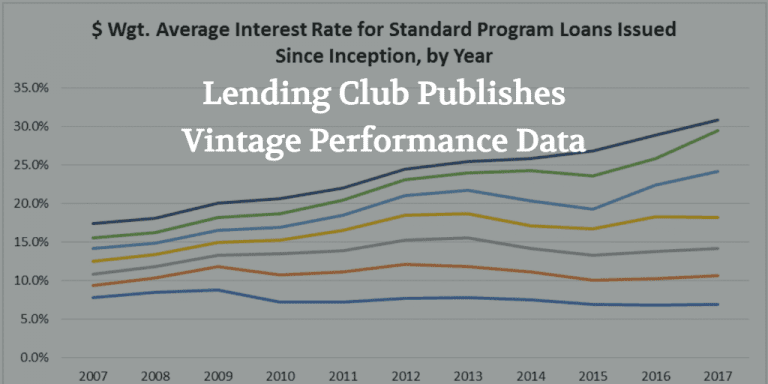
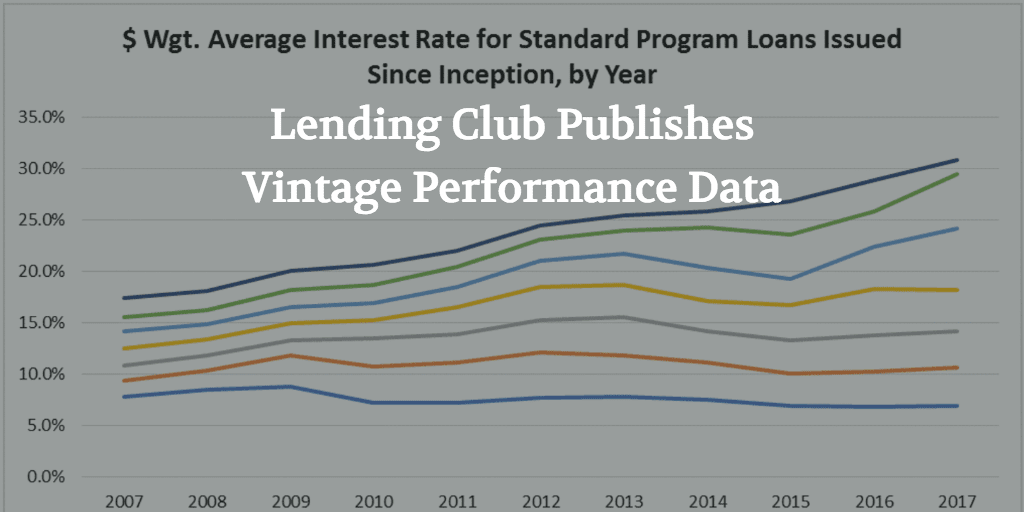
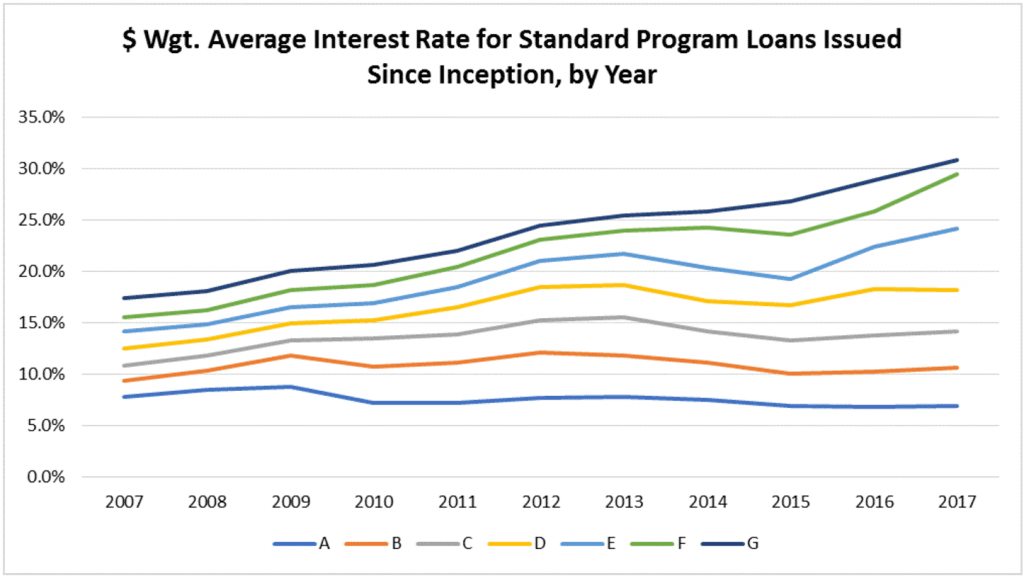
Visualizing Interest Rate Changes
Below is a chart of interest rates over time for grades A-G. While investors who track Lending Club changes closely won’t be surprised to see the increased interest rates since 2015 it shows how significant the changes have been, particularly in grades E-G. For many grades you can see a ‘V’ shape as interest rates decreased from around 2013 until 2015 when they started to increase. Hopefully the increased rates with current vintages will begin to shift the downward trend of returns most investors are now experiencing from loans originated in 2015 and 2016.
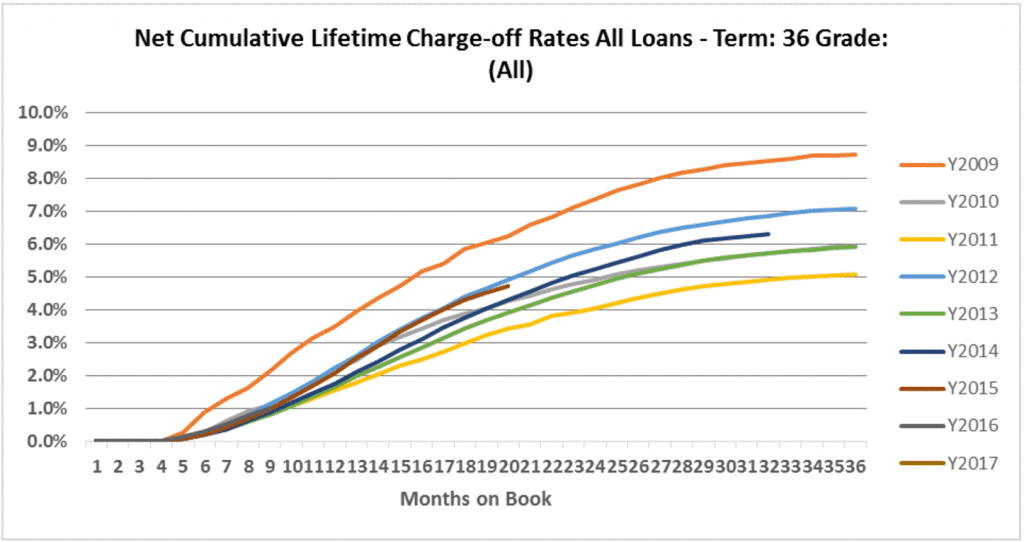
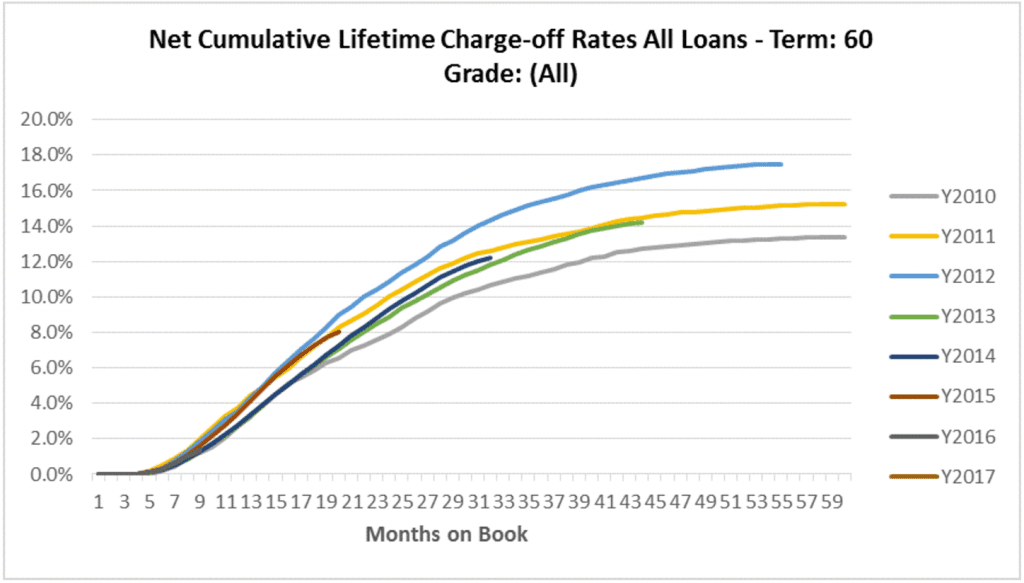
Platform Cumulative Charge-offs Are More Stable
The below charts show net cumulative lifetime charge-offs on all loans for 36 and 60 month loans respectively. It’s important to stress that this is across all loan grades for a particular year meaning that it is skewed towards less risky loans (loan originations by grade are outlined in detail in the S-3ASR). If you invested across the platform in 2015 your performance remains in line with 2012 vintage although your charge-offs are still elevated from some of Lending Club’s best vintages. Looking at this chart alone it’s hard to point to 2015 being a problem year for investors which was amplified in the the higher risk notes (outlined later). 2015 charge off rates at month 19 are 40 bps above 2014, 80 bps above 2013 and 130 bps above 2011 (the best performing vintage of 36 month loans).
While still early, 60 month loans originated in 2015 are performing in line with the 2011 vintage. 2015 charge-offs at month 19 are 100 bps higher than 2013 and 80 bps higher than 2014.
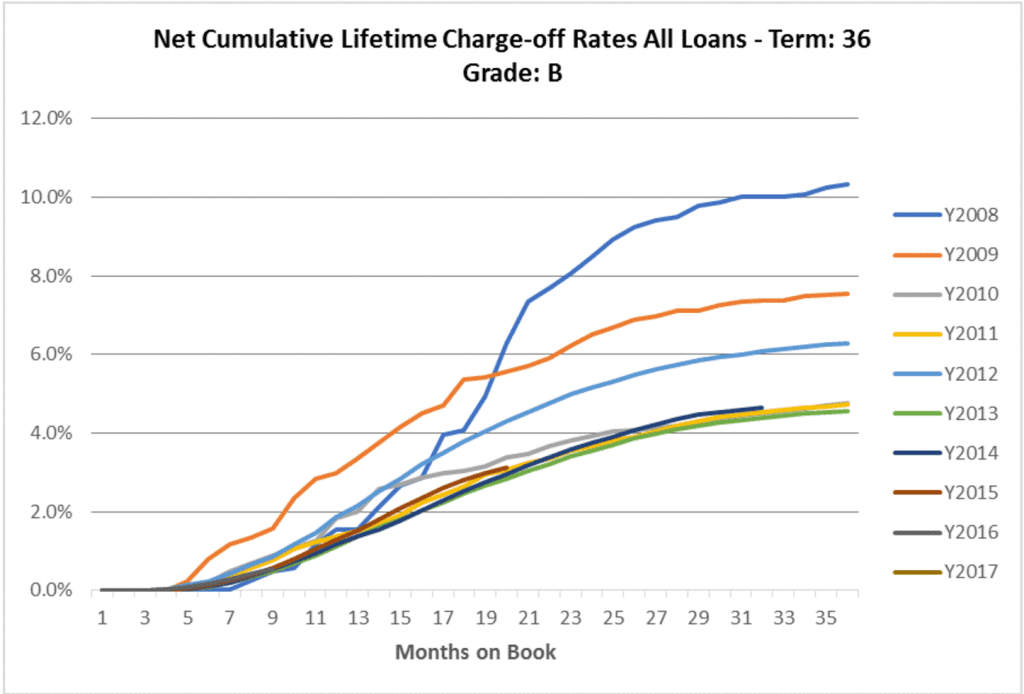
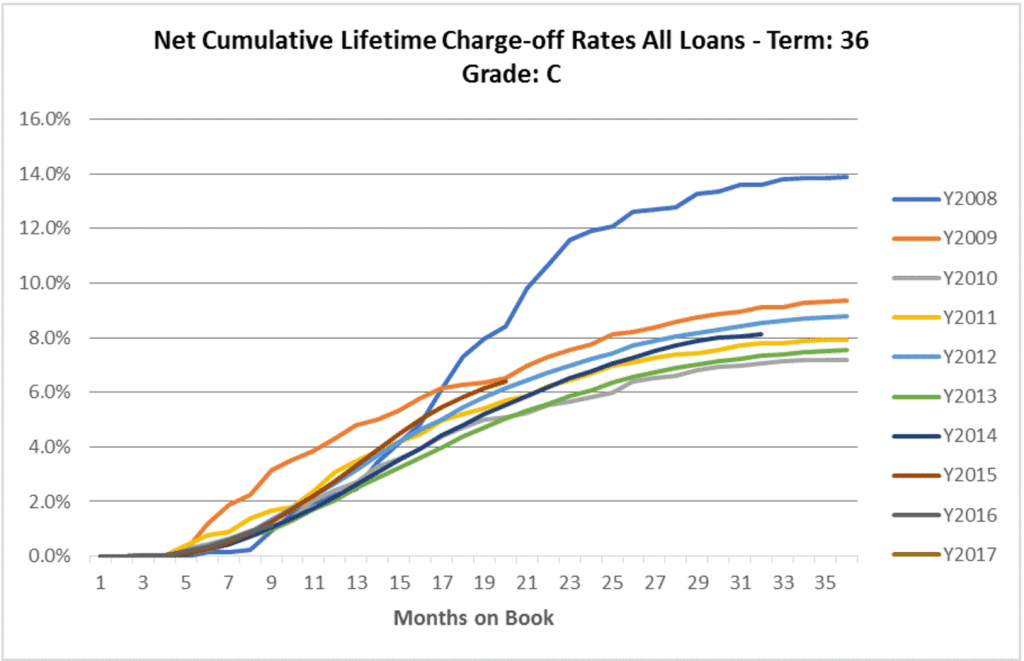
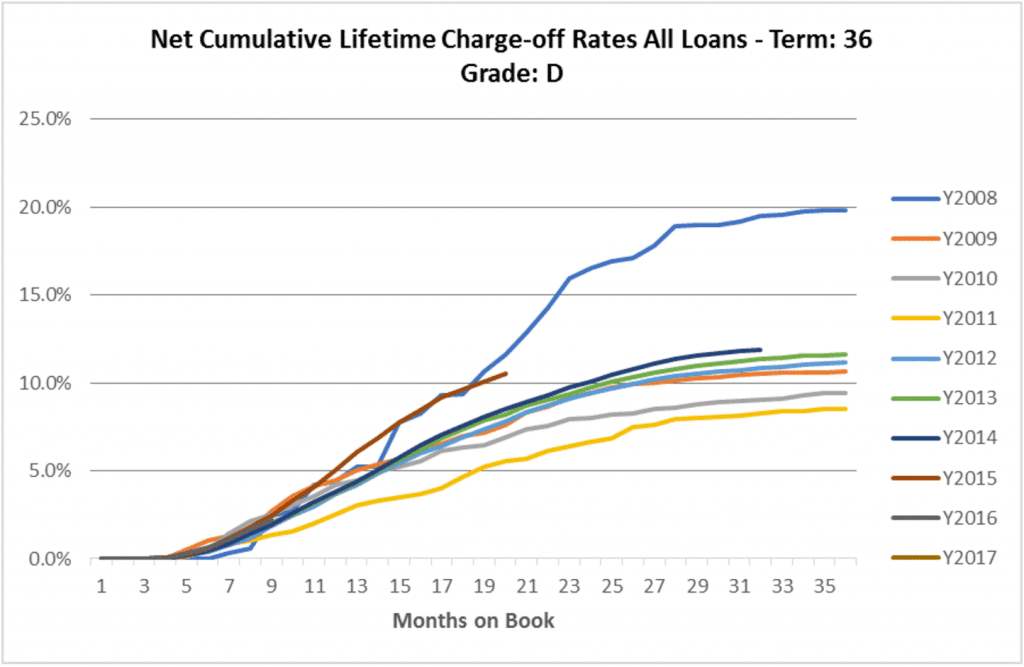
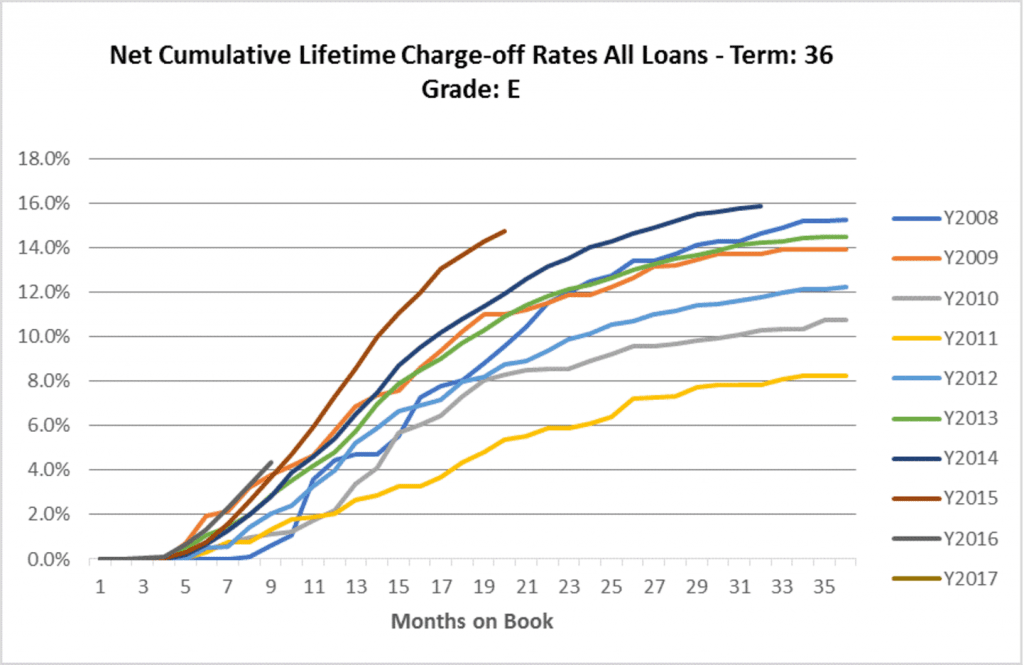
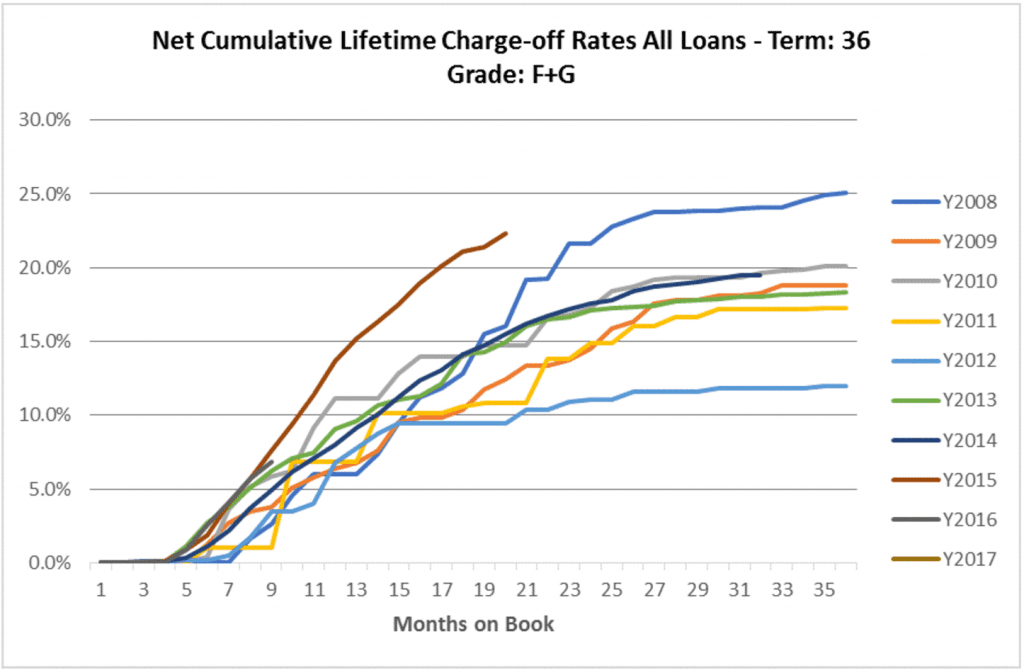
36 Month Loan Charge-Offs By Grade
Below are charts showing the net cumulative charge-off rates for 36 month loans split up by loan grades. As you scroll through the charts you’ll notice that the 2015 vintage pulls further away from the other vintages. Investors in grades A-C fared much better than those who invested in grades D-G. The charts reiterate the story of poor underwriting in the riskier loan grades, a story we have been covering extensively. For most loan grades it is hard to distinguish trends for the 2016 vintage with the exception of E grade loans where you can see charge-offs are trending higher than 2015. The same charts are available in the SEC filing for 60 month loans. 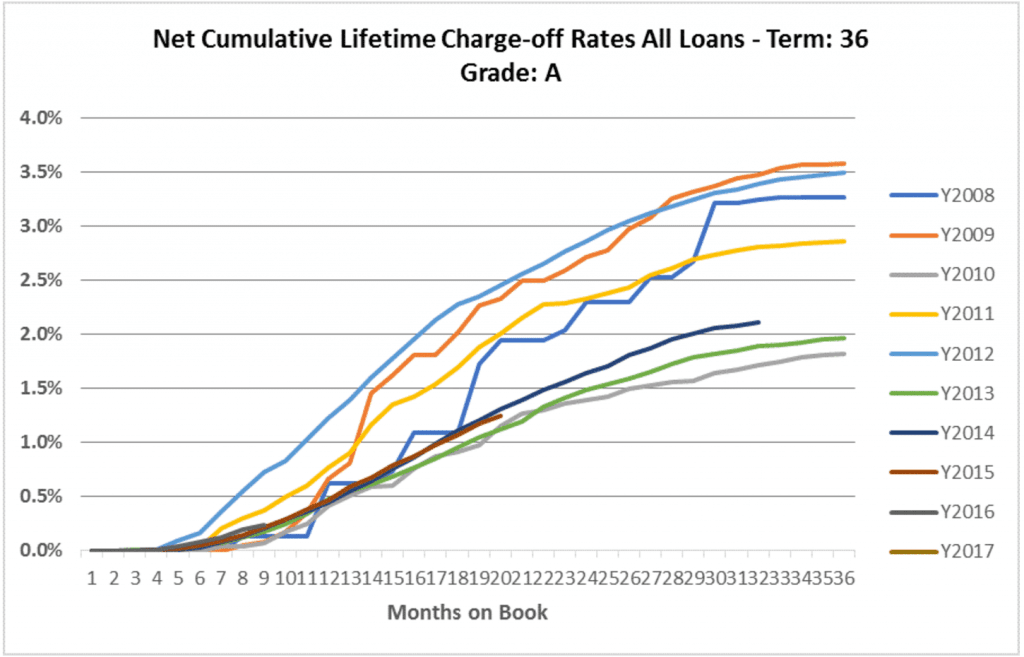
Conclusion
Many investors are well aware of the lackluster performance in 2015 and 2016 vintages as they have seen it firsthand in their own portfolios. Peter Renton, Founder of Lend Academy reported this in his own returns where he saw a negative quarterly return for the first time ever, since beginning to invest in 2009. For investors who aren’t willing to handle the volatility of the riskier loan grades the above information makes a strong case for a more conservative investment approach. Looking forward it’s going to be interesting to track both the Q3 and Q4 2016 vintages which is the point where most of the significant interest rate adjustments have been made.
If you have any thoughts on recent performance or any other takeaways you gathered from the data or charts in Lending Club’s S-3ASR let us know in the comments.