

A question investors often ask when investing in Lending Club and Prosper loans is whether they should invest in 36 month loans, 60 month loans or both. This question up until recently was more difficult to answer because few 60 month loans had reached maturity. We’ve been able to analyze 36 month vintages for quite some time but 60-month loans only began in 2010 and initially it was at a very small scale. In this post we’ll dig into what the data says using NSR Invest and also provide other considerations to help answer this question.
According to NSR Invest, Lending Club has originated 791,826 36 month loans and 327,355 60 month loans as of Q2, 2016. As of Q2, 2016 Prosper has originated 390,782 36 month loans and 168,881 60 month loans. As a side note Prosper has also issued 1,614 12 month loans, but we will ignore these loans for this analysis since they have not originated 12 month loans since 2013. Our analysis will focus on a subset of these loans of fully matured vintages.
There are a few things to keep in mind as you go through this analysis:
- Generally loans of a longer term have higher interest rates to compensate for the additional risk.
- Both Lending Club and Prosper continually modify their underwriting models. What may have produced higher or lower returns in the past may not do so in the future.
- There are interest rate considerations that may affect returns. Since your money is tied up for longer with 60 month loans you may be better off if interest rates decrease over time. Vice versa if rates increase you aren’t reinvesting as fast in these new, higher interest loans.
Lending Club 36 vs. 60 Month Loans
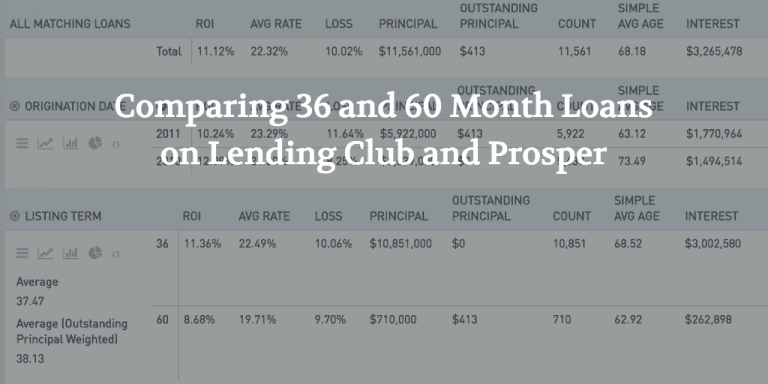
First we’ll look at Lending Club 60 month loans using the following filter criteria. The same criteria will be used to our 36 month analysis with the exception being to only include 36 month loans.
- Issue date: 1/1/2010 – 8/31/2011
- Assumptions: Equally weight all loans at $1000
- All loan grades
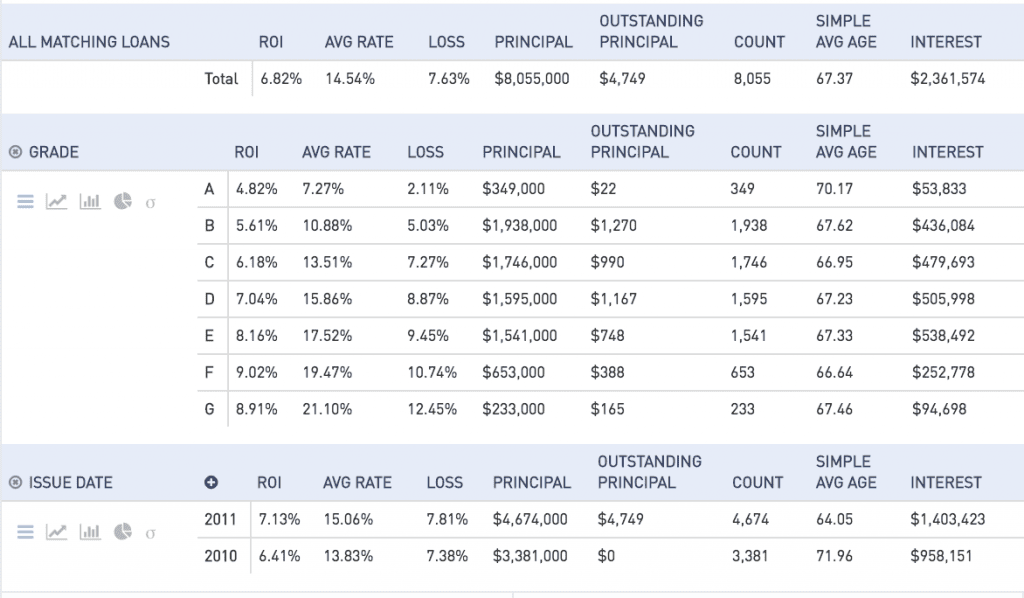 Lending Club 60 Month Loans
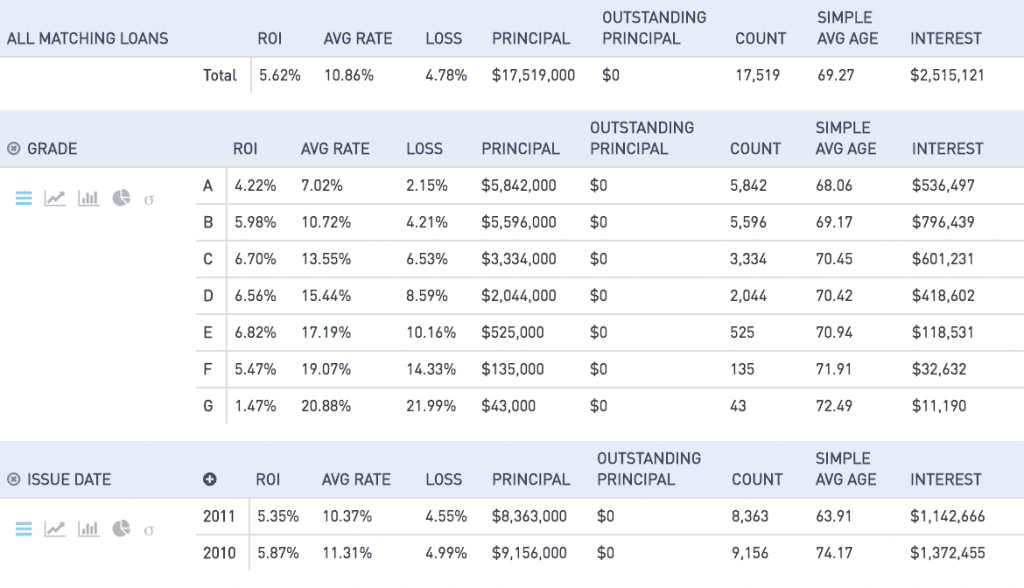 Lending Club 36 Month Loans
For comparison purposes we’ll ignore loan grades F and G since there weren’t enough loans originated in these grades for the numbers to be significant in our analysis.
Average Interest rates (Lending Club 36 vs. 60)
The trend of average interest rates across grades is not surprising. With the exception of C grade loans, loans of 60 months carry a higher interest rate.
- A36: 7.02% vs. A60: 7.27% (25 bps increase)
- B36: 10.72% vs B60: 10.88% – (16 bps increase)
- C36: 13.55% vs. C60: 13.51% – (4 bps decrease)
- D36: 15.44% vs. D60: 15.86% – (42 bps increase)
- E36: 17.19% vs. E60: 17.72% – (53 bps increase)
Returns (Lending Club 36 vs. 60)
The results are mixed. 36 month loans outperform 60 month loans in grades B and C. Returns for grades A, D and E are higher for 60 month loans. What’s interesting is that B and C grade loans represent the smallest difference in interest rates between 36 and 60 month loans (16 bps and 4 bps respectively). For loan grades A, D and E the difference in interest rates is 25, 42 and 53 bps respectively. There are many variables at play here so it is impossible to draw conclusions on the reasoning for the similarities in interest rates for B and C graded loans across loan terms. For instance, perhaps only high quality borrowers had been offered these 60 month loans.
60 month E loan grade loans were the best investment over this period returning 8.16% to investors. E 36 month loans returned 6.82%. If you were to have invested across all loan grades your returns would have been higher with 60 month loans (6.82%) than with 36 month loans (5.62%). Given the higher returns on average at least with these vintages make a strong case for including 60 month loans in your portfolio.
- A36: 4.22% vs. A60: 4.82% (60 bps increase)
- B36: 5.98% vs B60: 5.61% (37 bps decrease)
- C36: 6.70% vs. C60: 6.18% (52 bps decrease)
- D36: 6.56% vs. D60: 7.04% (48 bps increase)
- E36: 6.82% vs. E60: 8.16 % (134 bps increase)
Prosper 36 vs. 60 Month Loans
For Prosper loans we will look at similar loan filter criteria but we will ignore loan grades since the sample size of each loan grade is not large enough for comparison purposes.
- Issue date: 1/1/2010 – 8/31/2011
- Assumptions: Equally weight all loans at $1000
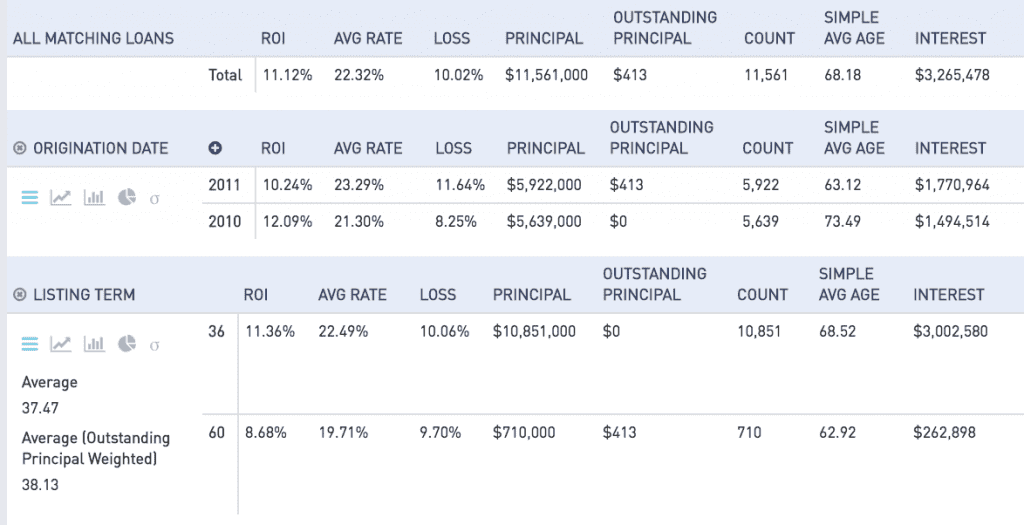 Prosper 36 vs. 60 month loans
If you were simply looking for a higher ROI, investing in 36 month loans in Prosper would have resulted in a higher return. However, The 720 60 month loans that meet our filter criteria also had a lower average rate. Lower rates generally correlate with less risk and thus lower returns so this is an important factor to keep in mind.
Conclusion
Deciding what loan terms to invest in comes down to personal preference and there are many considerations. Given the data, there is no clear conclusion as to what is the best strategy. Even though we focused only on mostly mature vintages in this post you can still see for yourself how other vintages are tracking using NSR Invest. This can help you make a decision with more recent data and take advantage of the changes that both Lending Club and Prosper have made to their underwriting over time. If you currently only focus on one loan term, diversifying into the other is something worth considering.